
Data Analysis and Visualization
- What it does: Reads an uploaded spreadsheet, CSV, or PDF, profiles it, answers questions in plain language, and builds charts and reports on request.
- Best for: Financial analysts, business and ops analysts, and consultants who need an answer from a file today.
- Apps used: None required. Built-in Code Interpreter only.
- Setup time: Under 5 minutes.
Last verified from workflow config on July 30, 2026. Includes common failure modes and fixes.
The Data Analysis and Visualization Agent reads an uploaded .xlsx, .xls, .csv, or .pdf file, profiles it, and answers questions grounded in the actual data. It builds charts, reports, or decks on request, using only the built-in Code Interpreter, with no third-party app to connect. This template acts as a starting point: open the agent and use Use AI to help draft or update its instructions. Adding new agents or connecting new tools is done manually in the canvas.
Problem this solves
- Manual spreadsheet work is slow. Someone still has to open the file, check for missing values, run the pivot, and build the chart by hand before anyone can act on it.
- General chat tools can fabricate numbers. Ask ChatGPT or a generic assistant to "analyze this" and it can produce a plausible-sounding figure that was never actually computed against your file.
- Multi-sheet workbooks get silently ignored. A tool that reads only the first sheet of an Excel file, or skips disclosing what else is in the workbook, can miss the actual answer.
- After: The agent computes every number through code, verifies the output actually exists before reporting it, and states the basis (n, filters, file, sheet, or page) behind every figure it gives you.
How do you build an AI agent for data analysis yourself?
A do-it-yourself data analysis agent generally needs four pieces working together:
- A file-handling layer: validates and profiles whatever gets uploaded.
- A code-execution sandbox (like a Python interpreter): actually runs the math, instead of guessing it.
- A charting layer: rules for which chart type fits which question.
- A report/export layer: assembles findings into something shareable.
Building this with a framework like LangChain, Google's Agent Development Kit, or a custom stack is a real, viable path. It typically takes real engineering time to get right:
- Getting the file-validation edge cases right (encrypted files, scanned PDFs, oversized uploads).
- Keeping the sandbox from silently truncating large datasets.
- Wiring a safe save pipeline, so a failed export doesn't get reported as a success.
This template ships that logic pre-built: file validation, multi-sheet profiling, chart-type selection, and a verified save pipeline are already written into the agent's instructions and its five attached skills. If you'd rather assemble the pieces yourself in code, see how structured-output handles the export-schema side of that problem; if you want the pre-built version, setup here takes under 5 minutes.
Click on "Use This Template" and create a Data Analysis & Visualization Agent for your work.
Setup guide
Open the Data Analysis and Visualization Agent template in Agent Space. Wait a few seconds for the skill files to be loaded properly in the system before doing anything else, since the agent needs its five attached skills fully loaded to profile a file correctly.
Step 1: Add any connectors
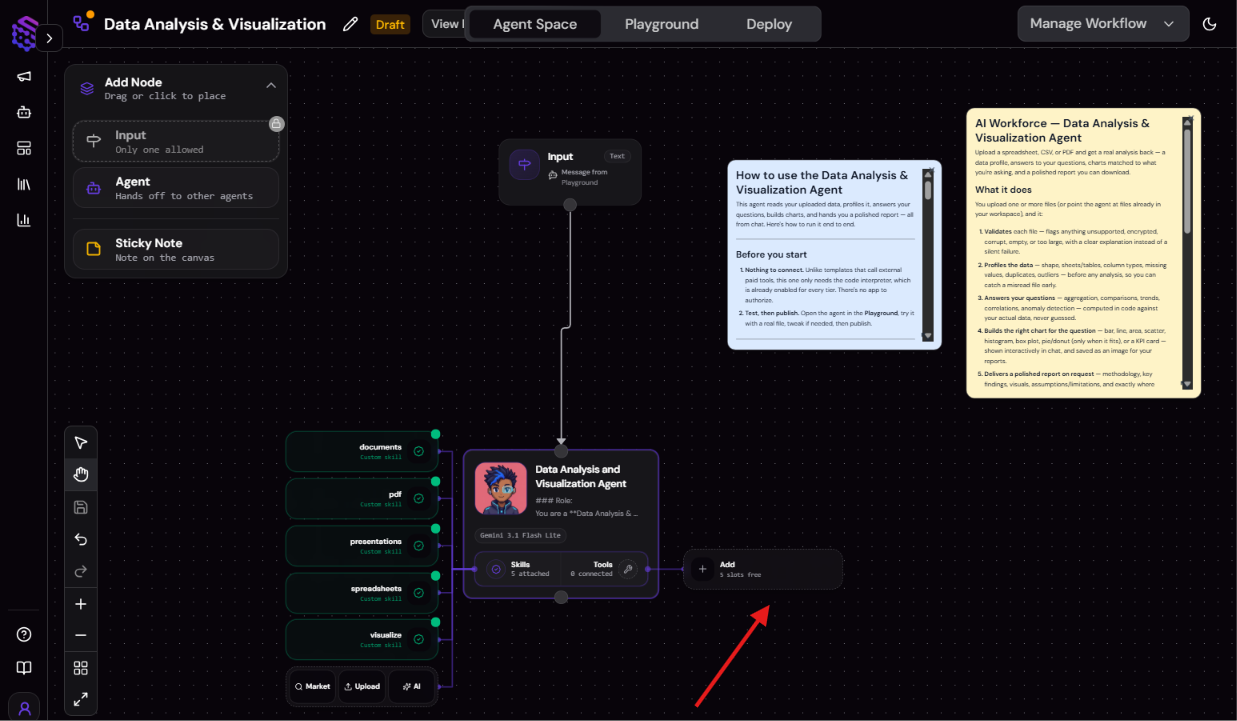
This template ships with no required connectors. The only capability it needs is the built-in Code Interpreter, already enabled on every tier including free, so there's nothing to authorize here.
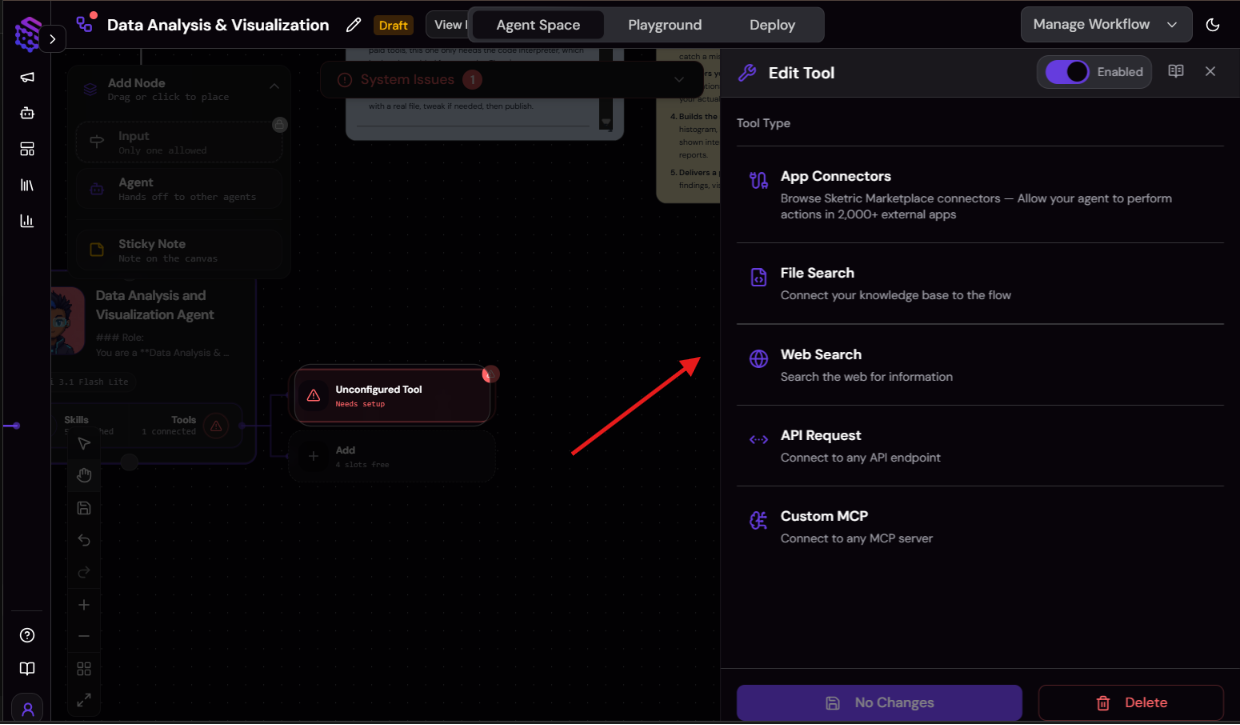
If you want to extend the workflow later, for example pulling data from a live source, add an app from SketricGen's library of 2000+ apps manually from the canvas.
Step 2: Test in the Playground with a real file
When skills are loaded properly, attach or upload a real .xlsx, .xls, .csv, or .pdf file in the 'Test' tab in the Playground, and name the file directly in your message if you have more than one file open in the workspace, so the agent knows which one you mean.
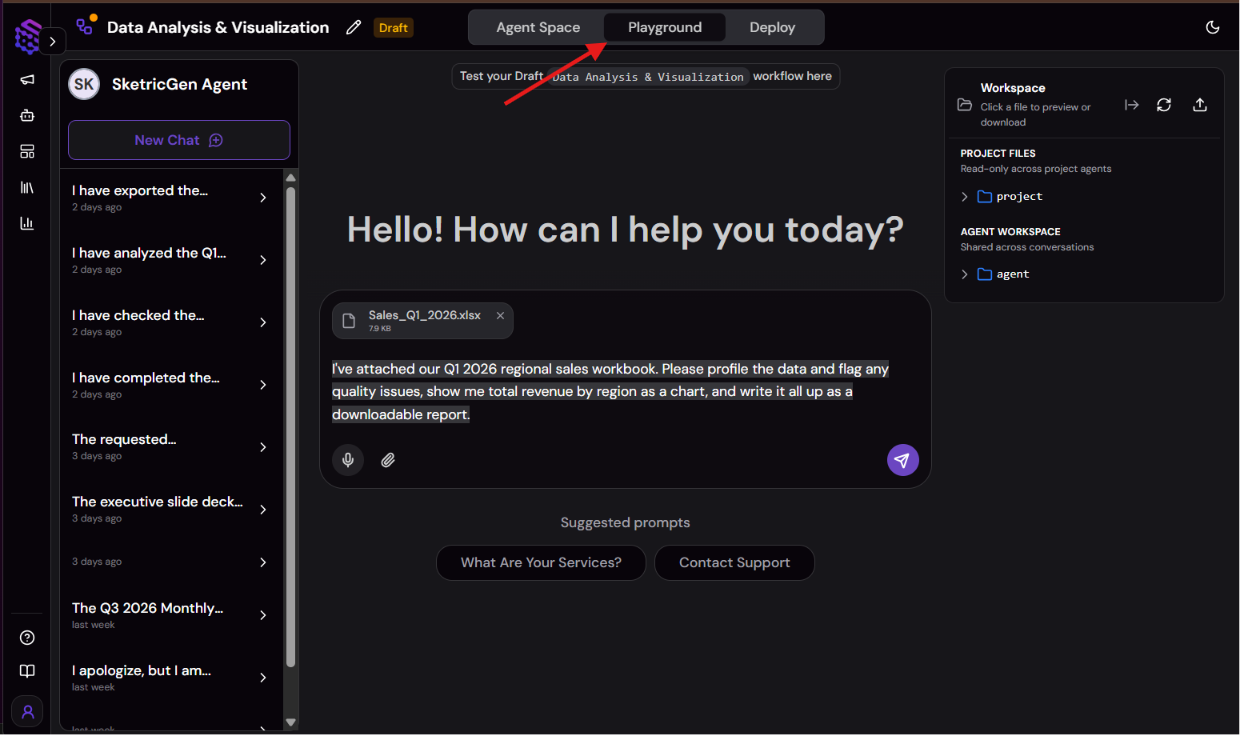
Step 3: Review the profile, ask questions, and request outputs
Once the file is attached, work through the agent's response in three parts:
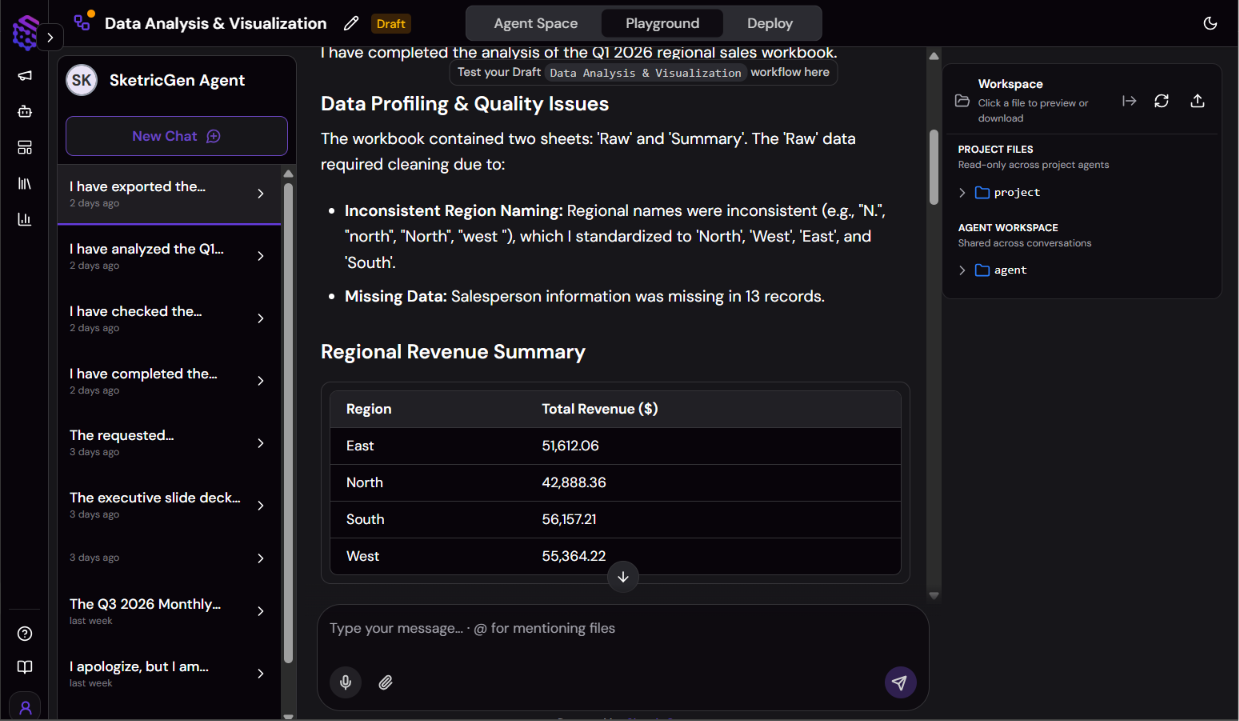
- Review the data profile it returns first: it should state the shape (rows and columns, or pages and tables), column names and types, missing-value counts, and for an Excel file, every sheet name it found, not just the one it analyzed deeply.
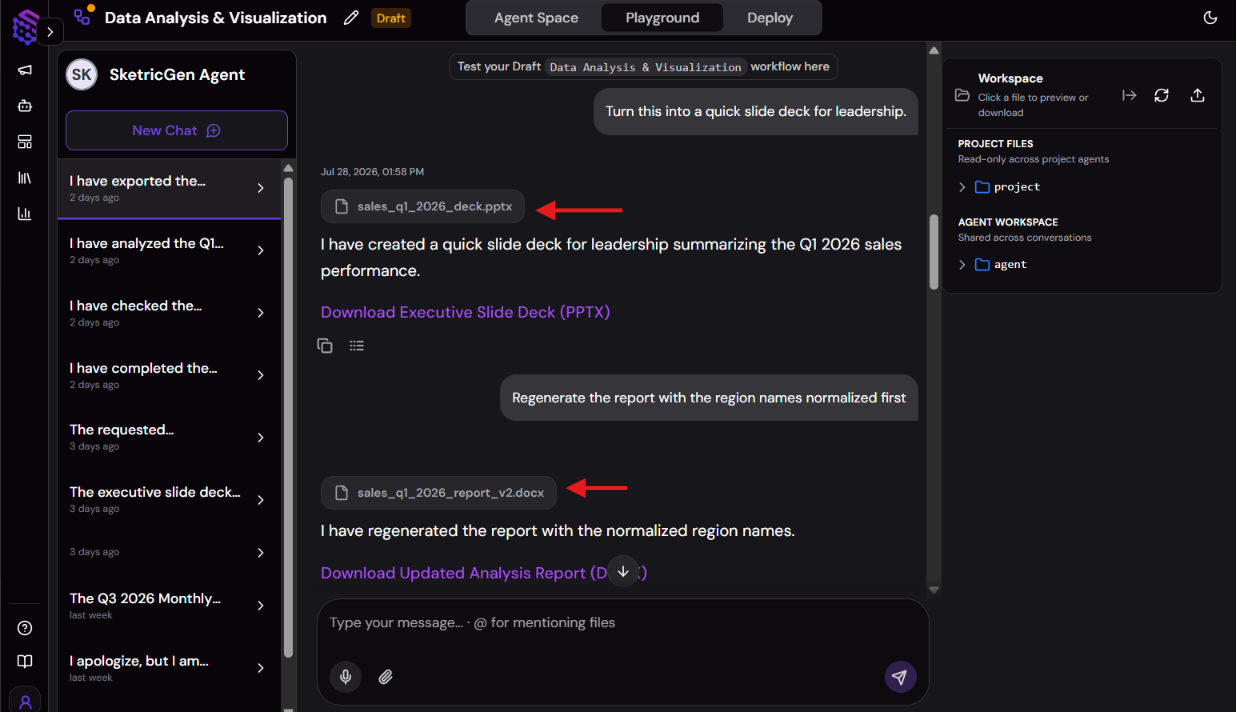
- Ask a real question and check the chart it returns, for example "what changed between Q1 and Q2." Confirm the answer states its basis (n, filters, file, sheet, or page), and that any chart matches the type of question, never a dual-axis chart.
- Request a report, and a deck only if you need one once there's a finding worth writing up. The default is DOCX; ask for PDF by name if you need that format instead, and ask separately for a slide deck only if you actually need one, since the agent never builds or bundles one automatically.
Step 4: Review the instructions, then publish
Open the agent's instructions panel and use Use AI if you want to tweak the wording, for example adding a stricter output-naming rule for your team. When you're satisfied with a test run, publish the agent.
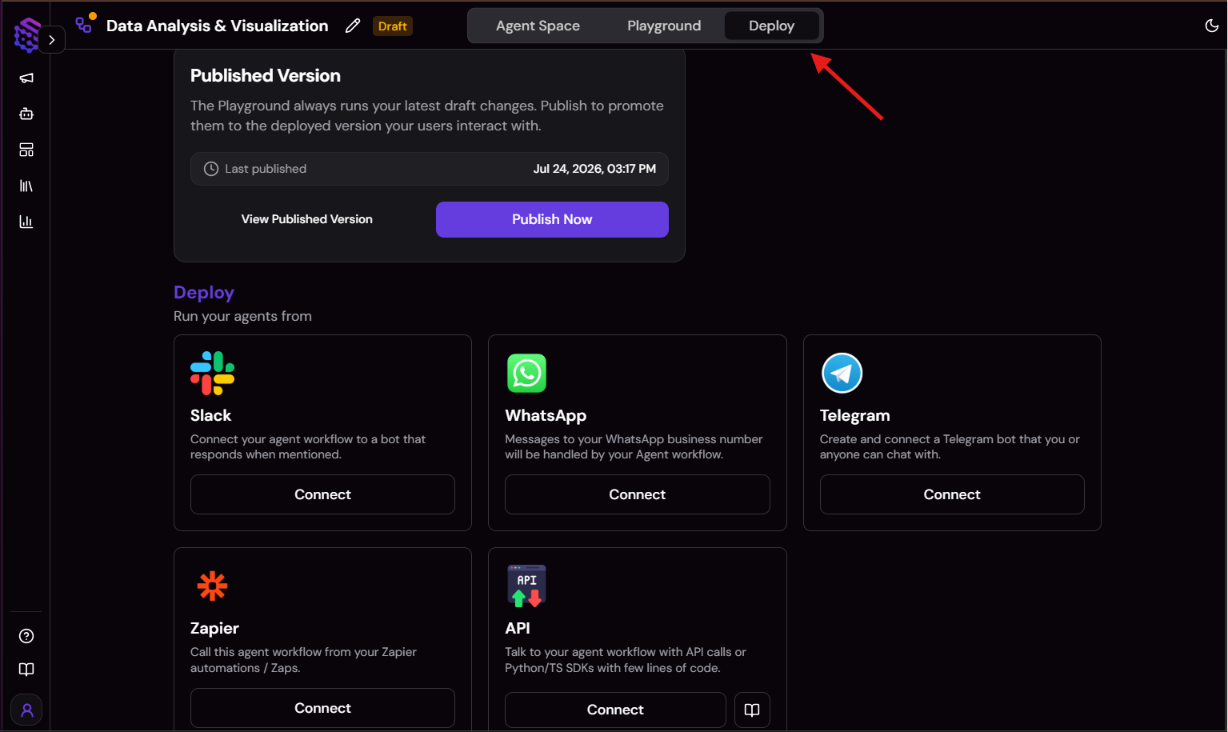
Common issues and fixes:
- File won't open or profile. The agent checks the extension and tries to open the file in code before analyzing; if it's password-protected, corrupt, empty, or oversized, it reports the specific problem instead of failing silently. Re-export or decrypt the file and re-upload.
- A number "seems off." Ask the agent to restate the basis (n, filters, file/sheet/page) behind that specific figure. If the basis doesn't match what you expected, the discrepancy is usually in the filter or sheet selection, not a fabricated number, since the agent never reports a figure it didn't compute.
- Scanned PDF text looks wrong. OCR is attempted on image-only pages but is explicitly labeled as OCR-derived and treated with extra caution; a searchable-text PDF is the dependable path if accuracy matters.
- Deck shows up without being asked for. This shouldn't happen per the instructions, since a deck is built only on an explicit request; if it does, flag it and re-test the exact prompt that triggered it.
- Ambiguous file match with multiple files open. Name the exact filename in your message. The agent lists filenames and asks for clarification rather than guessing which one you meant.
Customization knobs: The agent's instructions (editable via Use AI) control the output naming pattern ({dataset}_{output-type}_{date}), the default report format (DOCX vs. PDF), and how aggressively it asks clarifying questions on a vague request like "analyze this."
Who it's for
- Finance and financial analysts. The clearest real-world fit for this exact file mix: multi-tab Excel budget models and PDF financial reports. The agent discloses every sheet in a workbook before analyzing, and extracts PDF tables with page-level provenance tagging. A scanned quarterly report and a live budget model both get handled with the source stated.
- Business analysts and ops or reporting roles doing ad hoc spreadsheet work. The "upload a file, ask a question, get a chart" workflow fits this role directly, with data-quality profiling (missing values, duplicates, outliers) running automatically before any analysis starts.
- Agencies, consultants, and freelancers producing client-facing reports. This segment is inferred from the template's capabilities, not from search-query volume. A default DOCX (or PDF on request) report matches an "analyze, then hand the client a clean deliverable" workflow. An on-request executive deck fits the same workflow, without a deck being forced into every job.
- Not a fit: teams expecting a live database or data-warehouse connection. This template is file-based only, no connector or OAuth setup exists in this workflow, so anyone needing a permanent Snowflake- or Databricks-style link should look elsewhere.
What the agent does
- Validates every uploaded file before analyzing it, checking the extension, whether it opens cleanly in code, and whether it's password-protected, corrupt, empty, or oversized, reporting the specific problem instead of failing silently.
- Profiles the data first, stating shape, column names and types, and missing-value counts, and for Excel files, discloses every sheet name found, not just the one it analyzes.
- Answers questions grounded only in the uploaded data, stating the basis (n, filters, file, sheet, or page) behind every figure, and asking a clarifying question only when a request is genuinely vague.
- Builds a matched chart when a visual clarifies the answer, choosing chart type by analytical intent and rendering both an interactive chat version and a saved static version that agree with each other.
- Offers a downloadable report once there's something worth writing up, not after every single message, defaulting to DOCX with PDF available on request.
- Builds an executive deck only when explicitly asked, condensing already-confirmed findings and existing charts rather than re-analyzing anything.
- Handles multiple files together carefully, confirming which files should be merged and surfacing schema conflicts like mismatched units or granularity instead of silently coercing the data.
- Samples or chunks large files, stating exactly how it did so rather than silently truncating data.
- Never fabricates a data point, a statistic, or a file. If a save genuinely fails, it reports the real error instead of writing a placeholder file to look like the task succeeded.
How it works
- Trigger: You send a chat message, optionally attaching a file (or referencing one already sitting in the workspace).
- Skill routing: The agent decides which of its five attached skills to load based on the task,
spreadsheetsfor tabular data,pdffor PDF extraction,visualizefor charts,documentsfor a DOCX/PDF report,presentationsfor a deck. - Code execution: All reading, math, aggregation, and chart rendering runs through the built-in Code Interpreter, a Python sandbox available on every tier including free, never computed "by eye."
- Verification: The agent checks that the code actually ran and the expected output or file exists before reporting anything as done.
- Save pipeline: Anything worth keeping (a cleaned dataset, a chart, a report, a deck) is written to a sandbox
outputs/folder, declared as anoutput_filesentry, then copied into/agent/, the workspace that persists across every future conversation with this agent. Nothing is saved by a direct write from Python. - Delivery: You get the answer in chat, plus a download link for anything saved, named using the pattern
{dataset}_{output-type}_{date}.
This is a single-agent template with no handoff to another agent. Every capability, from reading a file to building a deck, lives inside this one agent's instructions and its five skills.
Requirements
No third-party account, API key, or OAuth connection is needed to run this template. The only capability beyond chat is the built-in Code Interpreter, available on every plan including free.
- Supported files:
.xlsx,.xls,.csv, and.pdf. Chat attachments generally cap at 10 files and 20MB per file. - Scanned PDFs: OCR is attempted on image-only pages but isn't a documented guarantee. A searchable-text PDF is the dependable path if the numbers matter.
- Optional later: nothing here is required, but if you later want this agent to pull data from a live source instead of an upload, SketricGen's library of 2000+ apps is available to connect manually from the canvas, similar to how web-lead-extractor pulls its input from the web instead of a file.
Apps used
| App | What it's used for | Typical permission scope |
|---|---|---|
| Code Interpreter | Runs Python in an isolated, offline sandbox to read files, compute statistics, render charts, and assemble reports/decks | Built-in on every tier, no authorization needed |
This template ships with no required external app connections. Nothing to authorize means one less setup step, but if you want to extend the workflow later (for example, pulling a report straight from a connected drive), SketricGen's library of 2000+ apps is available to add manually.
Use cases
- Financial model variance analysis. Upload a multi-sheet budget workbook and ask what's driving a change between two periods, with the answer citing exactly which sheet and filter it used. Best for: finance and financial analysts.
- PDF financial report extraction. Extract and sanity-check tables from a scanned or text-based PDF report, with any OCR-derived figures flagged as such. Best for: finance and financial analysts.
- Cleaning a messy CSV export. Profile a raw export for duplicates, missing values, and outliers before anyone reports on it. Best for: business and ops analysts.
- Plain-language question to chart. Ask a question in normal language and get back the chart type that actually matches it, not a generic bar chart by default. Best for: business and ops analysts.
- Client-facing report assembly. Turn an analyzed dataset into a DOCX or PDF report with embedded charts and captions ready to send. Best for: agencies and consultants.
- On-request executive deck. Condense already-confirmed findings into a short slide deck, only when asked, without re-running the analysis. Best for: agencies and consultants.
Example prompts/outputs
Example 1 Prompt: "What's driving the increase in Q2 marketing spend in this workbook?" Output: A grounded answer stating the specific sheet and filter used, the dollar change, and (if a chart clarifies it) an inline trend chart, never a bare number without its basis.
Example 2 Prompt: "Turn this into a one-page report." Output: A downloadable DOCX with a title, 3 to 6 key-finding bullets, methodology, detailed findings with embedded static charts and captions, and an assumptions and limitations section.
Example 3 Prompt: "Build me a 5-slide deck of the key findings." Output: A PPTX deck built only because it was explicitly requested, condensing the already-confirmed findings and existing chart images rather than re-analyzing the data.
Example 4 Prompt: Upload a scanned PDF and ask "summarize the totals on page 3." Output: An answer that explicitly flags any extracted figures as OCR-derived, with a note to double-check against a text-based version if the numbers matter.
Why you need this template
- It won't hand you a guessed number. Every figure traces back to code that actually ran against your file, with the basis stated, unlike a general chat tool that can produce a confident-sounding answer it never actually computed.
- It won't hide a sheet from you. Multi-tab Excel workbooks get every sheet disclosed up front, so you're not silently missing a tab the agent decided not to look at.
- It tells you what it doesn't know. A trend claimed from too few data points gets called out as such, and observed fact is explicitly distinguished from inference, rather than blurred together.
- Nothing to authorize before you start. No app connection, API key, or OAuth step stands between you and your first analysis.
- The report only gets built once there's something to say. You won't get an unsolicited report or deck after every single message.
FAQs
This template acts as a starting point, not a locked flow.
- Open the agent and use Use AI to help draft or update its instructions, for example changing the default report format.
- Adding new agents or connecting new tools is done manually in the canvas, not automatically.
It covers similar ground, reading a file and answering questions with code, but with a few concrete differences.
- It automates repetitive steps like file validation and multi-sheet disclosure so they happen every time, not only when you remember to ask.
- It never fabricates a missing value or a file, and explicitly separates observed fact from inference, which neither general answer engine states as a guarantee.
- A deck is built only on request and never bundled with a report by default.
Yes, but with a caveat worth knowing before you rely on the output.
- OCR is attempted on image-only pages, and any OCR-derived figures are explicitly labeled and treated with extra caution.
- A searchable-text PDF is the dependable path if the numbers need to be exact.
No. This template is file-based only.
- There is no connector or OAuth setup anywhere in this workflow, since the only capability is the built-in Code Interpreter.
- If you need a live warehouse connection instead of file uploads, this template isn't the right fit.
No. A deck is built only when you explicitly ask for one.
- It's never offered proactively and never bundled with a report by default.
- When you do ask, it condenses already-confirmed findings and existing charts rather than re-analyzing the data.
The agent samples or chunks it rather than silently truncating it.
- It states exactly how it sampled or chunked the data so you know what was and wasn't included.
- No pay-per-run charge applies since the analysis runs on the built-in Code Interpreter, not a paid external API.
You'd need to wire together file validation, a code-execution sandbox, chart-type logic, and a report generator yourself, typically with a framework like LangChain or a custom stack.
- See "How do you build an AI agent for data analysis yourself?" above for the full breakdown of what that build actually involves.
- This template ships that logic pre-built, so the main tradeoff is setup time versus long-term control over the stack.
Yes, through the agent's instructions.
- The default naming pattern is
{dataset}_{output-type}_{date}, editable via Use AI. - Saved outputs land in
/agent/, the workspace that persists across every future conversation with this agent.
Any industry. The agent never assumes a vertical.
- It accepts any
.xlsx,.xls,.csv, or.pdfregardless of schema or industry. - Finance is the clearest fit based on real search demand, but the underlying skills (profiling, charting, reporting) apply the same way to any dataset.
The agent reports the real error rather than pretending the task succeeded.
- It never writes a placeholder file to make a failed save look complete.
- You'll get a specific explanation of what went wrong instead of a silent failure.
Related templates
View more
WhatsApp AI Agent
Answers WhatsApp support questions from your brand knowledge base, and never invents a policy.
AI Receptionist
Learns your brand from your website, answers FAQs 24/7, and books demos on Google Calendar.

Smart Email Manager
Gmail triage, drafted replies, Notion logging, and Slack alerts in one agent.

Instagram DM Automation
Auto-replies to Instagram DMs from your brand's own knowledge base.

Shopify Niche & Competitor Analyzer
Scans a Shopify niche or benchmarks named competitors with a ranked leaderboard and modeled revenue.

SEO Optimized Blog Writer
Research your brand, search intent, SERPs, and competitors through a ten-stage editorial workflow to create original, source-backed articles built to rank.